The First Year • COVID in Ontario
In retrospect it’s absurd that we shut everything down a year ago for 900 cases given that we’re now seeing 2,000 new ones a day.1 Let’s remember however that the slogan then was to 'flatten the curve’. What exactly did that mean?
The ‘curve’ is the line made when plotting out new daily infections, reflecting the triumph of Cartesian technocracy. The infections were doubling in a short period of time (growing exponentially) and so ‘the curve’ created by the graph’s plot was going straight up. The idea was to lower the new infections so that the plot’s curve would flatten out, and spread out infections to a manageable level. Notably, the strategy was never to stop the infections from happening, and I didn’t hear anyone say ‘collapse the curve’. 2
The Authorities thus accepted infection as an inevitability. In the days surrounding the World Heath Organization’s Declaration of a Pandemic (believed to have been under pressure by China not do so), Germany’s Angela Merkel stated that 30% to 70% of Germans could be infected. This appeared to be a WHO talking point, since the same range was stated by Canada’s Minister of Health Patty Hajdu on March 12 2020. I did the math: using a death rate of 2.5% to 3.7% (derived from the numbers from China), I applied these rates to the Canadian population of 37.6 million.
Thirty Percent of the Canadian Population (11.28 million) and a death rate of:
2.5% = 282,000 dead vs.
3.7% = 417,360 dead
Seventy Percent of the Canadian Population (26.32 million) and a death rate of:
2.5% = 658,000 dead vs.
3.7% = 973,840 dead
In the past year we have never come close to meeting these numbers. The actual infection rate for the country so far has been 2.5%3.
On April 3 ’20, the province released their modelling numbers to justify the lockdown. They stated that without the social distancing that had begun three weeks before, they would have expected 100,000 deaths. (The number dead that day was 67). With the restrictions, they expected a range of 3,000 to 15,000 deaths over the next two years (present dead on March 28 2021: 7,327). They projected 80,000 cases and 1,600 deaths for the end of April 2020. In actuality, Ontario recorded 16,187 cases and 1,082 deaths on April 30 ’20.
When SARS erupted in 2003, quarantines were used for the first time in decades, and that coronavirus was managed into extinction. This coronavirus is officially named SARS COV-2, the acronym meaning: Sudden Acute Respiratory Syndrome Coronavirus Two. (COVID-19 in turn means Coronavirus Disease 2019). It remains a controversial hypothesis that it was a genetically engineered version of the 2003 virus created for research purposes escaped from the lab. Again, to emphasize the point: SARS was managed to extinction. They adopted a SARS Zero approach.
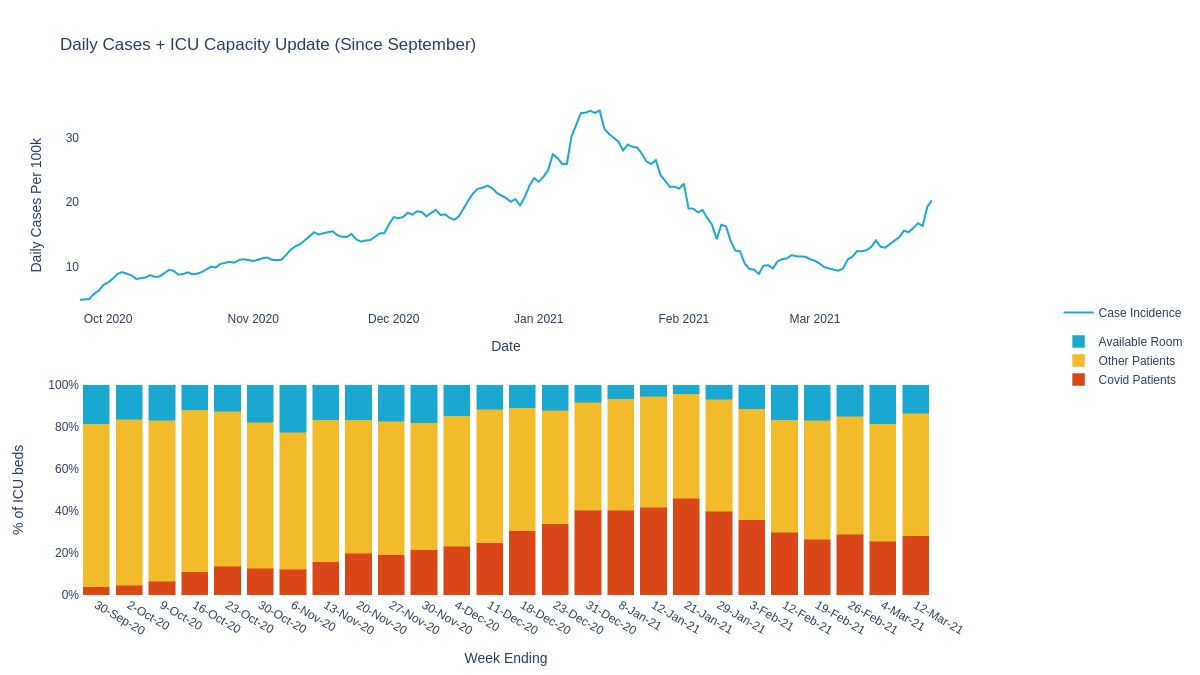
Again, flattening the curve was always a strategy of creating waves so that the “inevitable” infections could be processed by the medical system. Social distancing and the shuttering of social gathering spots became a policy enforced by law. The graphs reflect the apparent success of the strategy, and waves were created. They are even visible in the hospital capacity graph:

This graph only begins in October ’20, leaving out the so called First Wave of Spring 2020, which had crested and troughed by summer. The number of active cases in Ontario peaked on April 26 ’20 at 5,878, and then began to fall.
By May initial restrictions were loosened and Toronto had begun their Active T.O. Program, notably shutting down a portion of Lakeshore Blvd on weekends to allow cycling. They also implemented a Quiet Streets program that restricted traffic in neighbourhoods.
On Saturday May 23 ’20, warm sunny weather led 10,000 people to congregate in Toronto’s Trinity Bellwoods Park. Premiere Ford admonished them the following Monday, telling them they should go get a test.
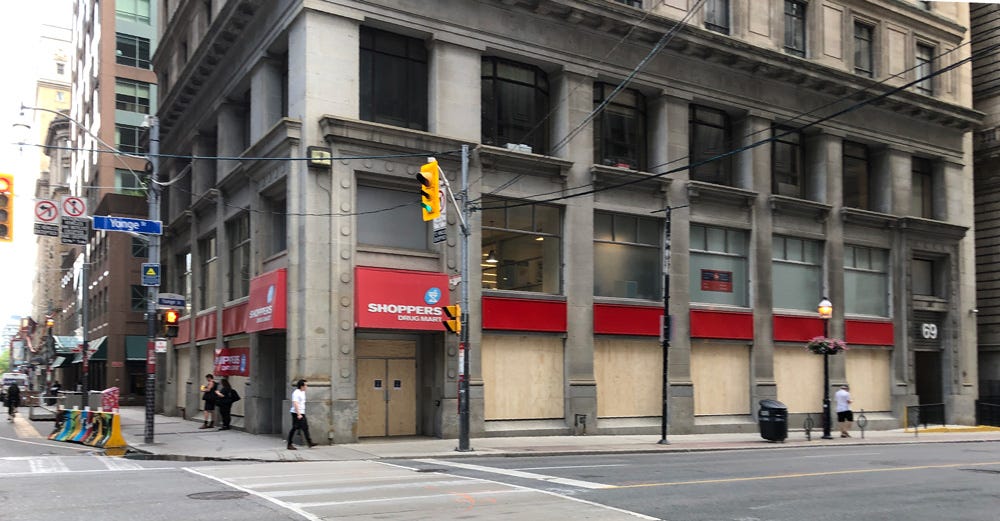
In early June, screenshots were appearing on social media stating that the Blac Bloc would be bussing down from Montreal to riot as part of protests that had spilled over from the United States after the George Floyd incident. I later read an analysis that stated this had been a psy-op (the use of screenshots of social media posts as opposed to an actual link to a post was a clue), and shops shut down and boarded up on the weekend of June 6 ’20.
The summer brought a new framework from the government: The Stages. The Spring Lockdown was retroactively named Stage 1. Stage 2 began for the province outside of the GTA on June 12 ’20. Toronto entered it on Wednesday June 24 ’20. Bars were allowed to re-open with sidewalk patios in July. The postponed Stanley Cup playoffs were watched on sidewalks under the summer stars, graced by Comet Neowise above the blanket of light pollution.
In the spreadsheet that I keep, I track the percentage of cases which are active. Active cases are measured by taking the daily total and removing recovered and dead. For example, on April 1 2020, the total cases in Ontario was 2,392, and of that, 689 had recovered and 37 had died. Active cases were thus 1,666, which was 70% of the total number. By May 1 ’20 the percent active was 28%, and by June 1 it was 14%. It continued to fall by halves: 6% on July 1 and 3% on August 1.
The best day within the past year was Thursday August 13 ’20, when we had 891 active cases. The Percent Active was 2.21%. The numbers began rising again after that: 92 new cases on August 14 ’20, 106 the following day.
From the beginning people understood they could be asymptomatically positive, and by the end of August, people were getting tests to confirm their status, which lead to long lines and backed up laboratories. In order to manage this situation, the Ontario government sensibly intervened with new criteria to determine eligibility for testing. At that time the test positivity rate was less than 1%, meaning 99.5% were negative.
The statisticians I follow on Twitter4 suspected the schools (about to re-open) would be vectors of renewed transmission, and they were apparently right, because the test positivity rate broke 1% for the first time approximately two weeks after the Labour Day weekend.
The Second Wave had begun. The graphical line now trended up through the end of the year and angled up as January began, reflecting unavoidable holiday socializing.
The worst day was Monday January 11 2021. Almost four thousand cases had been added the day before, and the total number of active cases on the 11th was 30,632. On the 10th, 29 people had died. On the 11th, 41 more.
The province had implemented a provincial shut down on December 26 ’20, and Toronto had been under a shutdown since the end of November. On January 12 ’21, the Ontario government declared a new state of emergency and issued a ‘Stay at Home Order’ that would begin in two days on January 14 ’21. Shops were to close at 8pm.
What did this mean in effect? You could go into a store that sold groceries and food (such as restaurant take out) but for everything else you had to order it online and line up at the shop to pick it up ("Curbside Pickup"). The Authorities emphasized you could go for walks and run your errands (always publicized as “groceries and prescriptions”). On Saturdays I went for bike rides to the east end of the city and got a coffee at the Tim Hortons at King St E & River St.
These bike rides began in April, and throughout I would take note of what I was seeing in the city. Line ups at Shoppers Drug Marts and grocery stores. Also line ups at Dollarama, cannabis shops, and LCBOs. The increase of windows papered over with For Lease signs. Bouncers had appeared at shops by the end of March ’20, enforcing social-distanced occupancy limits, and people then were discouraged from wearing masks because supplies were so low they wanted to avoid a rush and reserve them for the medical community. Capitalism spawned hundreds of mask makers and Instagram ads. I bought one from Instagram in May, by which time they’d become a social necessity.
What also caught my eye were the unintentional time capsules, things caught in a perpetual state of March 2020. Most notable to me was the Mulan poster on The Beach Cinemas, advertising an opening date of March 26 ’20 which never happened. (The movie was release on the Disney+ streaming service on September 4 ’20).
More than once, I encountered the demonstrators. In Toronto on Saturdays, a weekly gathering of protestors would assemble in Dundas Square and then march down Yonge St and onto Queen St. This parade was often accompanied by a truck carrying loudspeakers broadcasting an anti-lockdown speech by a speaker emphasizing that deaths had mostly occured in long term care homes (what I recall hearing) in addition to other COVID minimization. Infuriatingly, this parade was accompanied by police, there to ensure the right of protest and allow the parade to interrupt traffic. These came to an end with the development of the Second Wave and the province’s stay at home order, and arrests were made in Dundas Square on January 16 ’21.
The new restrictions introduced in mid January apparently had an effect, and the active case line began trending downward. The Second Wave had crested.
By early February one could dream of COVID Zero as the plotted line dotted a down slope day after day. The politicians however were managers of waves and not exterminators of sudden acute respiratory syndromes, and they relaxed restrictions as the numbers began to go down. It was announced that the Boxing Day Lockdown would end on Tuesday February 16 ’21.
Around December I began to reflect on how in the previous December (2019) no one expected what was to come. I’d first learned about the disease in China via a Tweet on New Year’s Eve, which was then called ‘SARS-like’. So by the end of 2020, I was joking ‘there’s still time for something to come along for next year’ but I didn’t want to believe it when the news media began reporting on the “British variant”. Was I supposed to believe that the coronavirus had mutated in order to repeat its performance for 2021?
Of course, a relatively simple genetic being like a virus is going to mutate, and it also follows that some of these variants will make the virus more infectious and dangerous. Within the official record (the daily PDF Epidemiologic Summaries published by the province), these new boogey men of genetic diversity first appear on January 28 ’21.
Despite the good news of the falling numbers in February, the statisticians were sounding the alarm. The mutations were more infectious, and we could expect to see a rise in numbers that would reflect this. A press conference was held on February 11 2021, and a moment from it went viral, when TVO reporter John Michael McGrath asked Dr Adalsteinn Brown about the modelling he had just presented. It’s worth quoting for posterity:
McGrath: I confess Dr. Brown, I’m a bit confused by this presentation. You say us sticking with the stay at home order will help, but the stay at home order is ending almost everywhere in Ontario on Tuesday [Feb 16]. You say that RT needs to be below 0.7 and we have never actually achieve that, and we’re about to -if not re-open - reduce a lot of public health measures. And those public health measure - as you say, as they’re lifted, cases could rise dramatically. Am I missing something here or is this presentation actually predicting a disaster?
Brown: No, I don’t think you’re missing anything. The cases will likely rise given the variants of concern, the need to keep that R down is really really critical but there are a number of things that need to be weighed when making these decisions.
Implied and understood by everyone here was that politics was interfering with public health, and the politicians were trying to placate those who’d protested and those who continued to have a voice in the media saying their business should be an exception to the rules (it seemed to be a commonly expressed by hair dressers and gym owners). I noticed that whenever cases were rising, the media would give voice to the statisticians and doctors who were calling for stricter measures, and when those measures were introduced, the media would shift to giving voice to those who felt the measures were too harsh.
The Province Wide Lockdown initiated on Boxing Day was removed on February 16 ’21. A week later on February 22 ’21, the graph’s downward slope begins to flatten out, indicating that the relaxed restriction began to halt the progress toward COVID Zero.
At this point I imagine the government’s plan to manage the illness into waves is metaphorically like coasting down a hill in a car. Gravity accelerates, and you can pump the breaks to maintain a safe speed. The government seems to accept the gravity of the situation and use its colour coded lockdown system to merely pump the breaks. They have displayed no interest in actually stopping the car.
As I write this at the end of March 2021 we are in the beginning of a Third Wave, driven (we are to understand) by the more dangerous variants. The Percent Active number fell to 3.39% on February 24 ’21 with active cases at 10,050. The next day, 1138 cases were added, and active cases rose by 21 to 10,071. It has since climbed to 18,405 (March 28 ’21), a number that we haven’t seen since the beginning of February. The Percent Active number is now at 5.36%.
For the past week, the cases have grown by approximately 2,000 a day. Which brings me back to the beginning: it’s absurd that we shut everything down a year ago for 900 cases when a year later we’re adding 2,000 a day and we’re both opening the patios and allowing hair cuts as of April 12 ’21.
As I write this on March 26th: On March 26 2020 Ontario recorded 835 active COVID cases, having added 170 that day. Today March 26 2021, Ontario added 2,169 cases and currently has 16,562 active cases.
Shut it down: It’s time for Canada to get serious about social distancing André Picard, The Globe & Mail, March 11 2020
On March 27 2021 the number of cases in Canada was 961,083 with 22,852 dead.


